 What Is Vibration Testing?
 What Is Vibration Testing?
Vibration tests are environmental durability tests that evaluate a product’s resistance and functional integrity against the mechanical vibrations it will face during use, transport, or storage.
These tests allow the vibration loads the product will encounter in real life to be simulated under controlled laboratory conditions.
Vibration tests are characterized by parameters such as Frequency (Hz), Acceleration (g), Displacement (mm), Velocity (mm/s), RMS-Grms values, and test duration. During the test, the product is fixed to the test table with an appropriate fixture and exposed to vibration at defined frequency, acceleration, and duration values. The product’s behavior is monitored throughout the test, and functional checks are performed before and after. Test profiles are determined according to the product’s usage scenario or relevant standards.
Vibration testing reveals issues that may occur during the product’s lifetime, such as loosening of mechanical connections, contact and solder problems in electronic components, structural damage and fatigue effects, performance loss, and functional faults. This way, the product is validated before it is deployed in the field.
Vibration tests can be applied in different profiles, including:
- Sine vibration test
- Random vibration test
- Resonance Search
- Sine on Random (SoR)
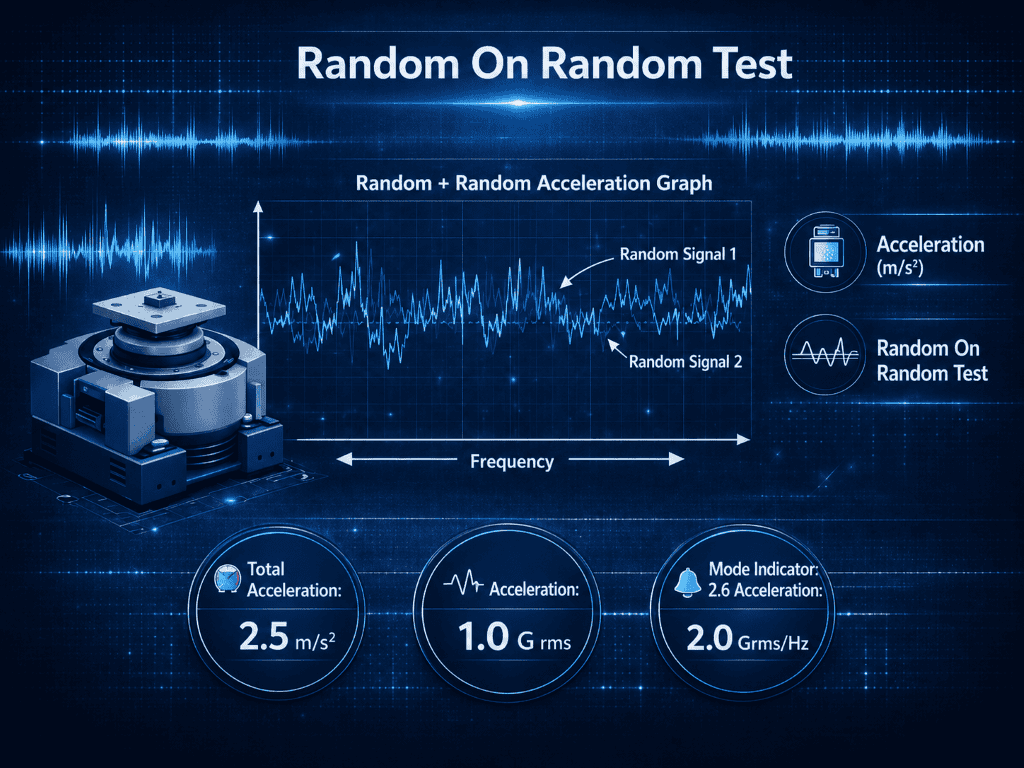
- Random on Random (RoR)
- Mechanical shock tests
Each test type represents a different vibration scenario.
Applied Standards
Vibration and mechanical shock tests carried out by OTAM are performed with reference to the following national and international standards:
- MIL-STD-810G — Method 514.6 (Vibration), Method 516.6 (Shock)
- MIL-STD-810G Change 1 — Method 514.7 (Vibration), Method 516.7 (Shock)
- MIL-STD-810H — Method 514.8 (Vibration), Method 516.8 (Shock)
- NATO AECTP-400 — Method 401
- EN 60068-2-27
- ISO 16750-3
- MIL-STD-167-1A
- MIL-STD-167-1
- ASTM D4169-22
- EN 60068-2-53
Vibration testing, which is critically important in the defense, aerospace, automotive, and industrial manufacturing sectors, is a fundamental engineering discipline used to verify the structural durability and performance limits of products.
Vibration tests at OTAM are carried out on a 70 kN electromagnetic shaker operating at vibration frequencies between 5-2500 Hz, as well as on a 160 kN servo-hydraulic shaker designed by OTAM for large-scale and heavy equipment, with a frequency range of 1-200 Hz and a table size of 2100 mm x 1600 mm.
Control Parameters in Vibration Testing
The loads applied during vibration tests are defined and controlled by specific physical quantities. These parameters determine the intensity, duration, and effect of the test on the product.
Resonance is the condition where vibration amplitude rises sharply when the natural frequency of a system matches the frequency of the applied vibration.
Every mechanical system has one or more natural frequencies, depending on its mass, stiffness, and damping. If the externally applied vibration matches one of these frequencies, the structure starts to vibrate at a much higher amplitude.
In the resonance region, displacement, velocity, and acceleration levels rise, fatigue damage accelerates, and dynamic stresses can reach maximum values. This can lead to mechanical damage, loose screws, electronic board failures, and fatigue fractures.
For this reason, resonance frequencies are specifically identified during vibration testing, the structural design and assembly details are validated, and the product design is improved accordingly.
Shock is a sudden, high-acceleration impact effect that occurs over a very short time. Its duration is short and its intensity is high. Shock events are typically defined by parameters such as peak acceleration (g), pulse duration (ms), and pulse shape (half-sine, sawtooth, trapezoidal, etc.). They produce high-frequency dynamic stresses on the system.
Real-world shock loads can occur during a product drop, transport impact, explosion or sudden impact environments, and ballistic effects in military applications. Shock tests evaluate whether the product can keep operating under these sudden, harsh loads or whether it sustains structural damage. Evaluation is generally based on structural integrity, permanent deformation, and loss of function. Shock resistance is often expressed using the Shock Response Spectrum (SRS).
The PSD (Power Spectral Density) curve is the graph used in random vibration testing that shows how much energy the vibration carries across frequency, that is, how “intense” the vibration is at each frequency. With this curve, the vibration environment a product will face can be reproduced realistically in the laboratory.
In a PSD plot, the horizontal axis (X-axis) represents Frequency (Hz), and the vertical axis (Y-axis) represents Vibration level (g²/Hz). The unit g²/Hz describes the acceleration energy carried by vibration in a specific frequency band. The PSD curve rises in frequency bands where vibration is intense and falls where vibration is weak.
Through the PSD curve, real environmental vibrations are represented in the laboratory and the frequency ranges in which the product will be most stressed are identified. The test level is defined in a quantitative and repeatable way.
RMS (Root Mean Square) is the basic measure that describes the total vibration intensity a product is exposed to during testing. In vibration testing, the RMS value is usually expressed in acceleration, with units of g RMS.
Acceleration changes constantly during vibration; sometimes it rises, sometimes falls, sometimes changes direction. The RMS value summarizes the overall stress effect of this constantly changing vibration on the product in a single number. So the RMS value can be thought of as the “average energy effect” of the vibration.
This value tells us:
- How intense the vibration environment was during the test
- The level of fatigue effect from the vibration
- A way to compare different test levels
Why Not Use a Simple Average?
Vibration signals are both positive and negative. A simple average comes out close to zero and does not show the true effect.
RMS calculation, in contrast:
- Counts negative values as well
- Gives more weight to large vibrations
- Represents the actual energy effect
For this reason, in vibration testing the RMS value is the most accurate way to describe vibration intensity.
The Relationship Between RMS and Random Vibration
The PSD curve shows how vibration is distributed across frequencies. In random vibration tests, the RMS value is obtained directly by integrating the PSD curve over the entire frequency band. This gives the total effect of the vibration distribution as a single number. In short:
PSD = the map of vibration across frequency
RMS = the total intensity of that map
As the Grms value increases, vibration energy rises, the risk of fatigue damage grows, and electronic and mechanical components are stressed more.
pk (peak) refers to the highest instantaneous acceleration value measured during vibration. Its unit is usually g (acceleration).
This value is important for showing sudden stresses, brief high loads, and impact-like effects.
The peak value is a critical control parameter, especially in shock tests, in resonance regions, and in systems containing sensitive components.
pk–pk (peak to peak) is the total difference between the highest positive value and the lowest negative value of a vibration signal.
It is generally used in displacement (mm pk–pk) terms.
It is especially important in low-frequency sine tests because large displacements, mechanical clearance issues, and the risk of impact or rubbing are evaluated using the pk–pk value.
Sweep rate describes how quickly the frequency changes during a sine vibration test.
The units are typically Hz/minute (Hz/min) or octaves/minute (oct/min). The sweep rate is very important: if the sweep is too fast, resonances may not be excited enough; if it is too slow, the product may be over-stressed. For this reason, the sweep rate is set according to the test standard and the type of product.
Frequency (Hz) shows how many times a vibration repeats per second. In vibration testing, the frequency range defines the rate at which the vibration applied to the product repeats.
Vibration tests are applied within a specific frequency band. This range is determined according to the product’s operating environment, transport conditions, and the relevant test standard. Low frequencies generally represent large displacements, while high frequencies represent high acceleration levels.
Vibration tests are typically performed across a wide band (for example 5–2000 Hz). This way, possible resonance points are captured, both large structures and sensitive components are tested, and real operating conditions are simulated more accurately.
Vibration amplitude describes how much a part moves during vibration or how much acceleration it experiences. In other words, it shows the intensity of the vibration. Vibration amplitude can be expressed by three different physical quantities: Displacement, Velocity, and Acceleration. All three describe different aspects of the same vibration.
Displacement
Displacement shows how far a part moves from its original position during vibration. Its unit is millimeters.
It is generally expressed as pk–pk (peak to peak). It matters more in low-frequency vibrations and in the motion of large, heavy parts.
Velocity
Vibration velocity shows how fast the part moves back and forth. Its unit is mm/s. Some industrial standards use velocity because it correlates well with vibration damage. It is meaningful in mid-frequency regions.
Acceleration
Acceleration shows how quickly the velocity changes during vibration. It is the most commonly used amplitude parameter in vibration testing. Units: g or m/s².
Acceleration best represents the stressing effect, especially in high-frequency vibrations, electronic boards, and small components.
The Relationship Between These Three
For the same vibration: as frequency rises, displacement decreases, and acceleration increases.
In other words:
| Frequency | Dominant Amplitude Type |
|---|---|
| Low frequency | Displacement (mm) |
| Mid frequency | Velocity (mm/s) |
| High frequency | Acceleration (g) |